NGI's Jack Prior Presents NOAA's Southeast Area Monitoring and Assessment Program (SEAMAP) Reef Fish Video Survey Results
September 30, 2021
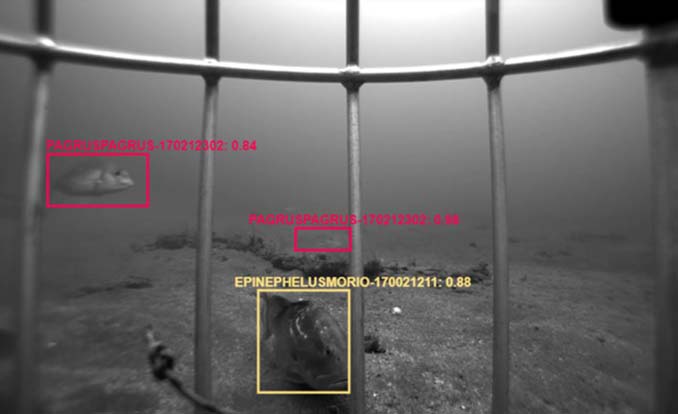
An example of automated fish detections and classification from the SEAMAP Reef Fish Video Survey. Pictured are two Red Porgy (Pagrus pagrus) and one Red Grouper (Epinephelus morio). The number following the species ID (Ex. 0.88) reflects the confidence of species classification.
Since 1991, NOAA's Southeast Area Monitoring and Assessment Program (SEAMAP) reef fish video survey has been conducted across the shelf of the Gulf of Mexico (Fig. 1) as a key fisheries independent stock assessment. Fish stocks are assessed by taking the minimum count of fish (Campbell et al. 2015) – defined as the maximum count of fish found in the same video frame. Recent advancement in camera technology and computing power has allowed for development of new image analysis software (Richards et al. 2019). This software will now allow the 30 years of video data to be brought back for use as a data library for the machine learning process.
Related Information and Citations:
github.com/VIAME/VIAME (Software and current models available for free)
B. Richards, O. Beijbom, M. Campbell, M. Clarke, G. Cutter, M. Dawkins, D. Edington, D. Hart, M. Hill, A. Hoogs, D. Kriegman, E. Moreland, T. Oliver, W. Michaels, M. Placentino, A. Rollo, C. Thompson, F. Wallace, I. Williams, and K. Williams, "Automated Analysis of Underwater Imagery: Accomplishments, Products, and Vision," NOAA technical memorandum NMFS PIFSC, 2019.
M. Campbell, A Pollack, C. Gledhill, T. Switzer, and D. DeVries. "Comparison of relative abundance indices calculated from two methods of generating video count data," Fisheries Research, 2015
